The 2026 Simon Abundance Index results were released today at HumanProgress.org. It is the first year where they have shown how much more abundant things have become in different countries around the world since 1980. China leads the world rankings, with their abundance score increasing by 3847% since 1980. Australia is 17th of the 42 countries measured, and are 267% more abundant than we were in 1980.
Young Australians today enjoy cheaper food, clothing and technology than any generation before them.
They also face a housing market, student debt burden and healthcare costs that their parents never did.
How have things changed from 1980 → 2025?
Picture two twenty-five-year-olds. One is starting out in 1980. They have cassette tapes, mortgage rates above 12%, a free university degree and a terrace house in Fitzroy for $50,000. The other is starting out today. They are streaming every film ever made, buying a new television for the equivalent of a few hours’ work, and staring down a $1.2 million median price for that same terrace while carrying a $40,000 HECS debt. Which one is better off?
The honest answer is: it depends entirely on what you’re measuring. The story of Australia since 1980 is a tale of two economies running in opposite directions at the same time. For traded goods, such as food, clothing, electronics, metals and energy, prices have collapsed relative to our wages. For the big fixed costs of a life, such as shelter, specialised healthcare, and higher education, prices have exploded. The result is a generation that has never been richer in some things, and has never found it harder to own the foundations of stability.
This piece draws on the framework of economists Marian Tupy and Gale Pooley, whose book Superabundance uses “time prices” to measure how abundance or scarcity has changed over time. Time price is how many hours of work it takes to buy something. Yes, the cost of things have increased over time. But how much have they really increased in comparison to how much our wages have increased in the same period of time? This is the important question to answer to see if things have become cheaper or more expensive.
I will apply that lens to Australia first to see how this differs from what is presented in Superabundance, and then to the sectors the book seems to conveniently exclude: housing, healthcare, and education.
Part One: Better
The World of Things Has Never Been Cheaper
Let’s start with the good news, because it is pretty great to hear about.
In 1980, the average Australian worker earned roughly $182 a week, or about $4.80 an hour. Today, median hourly earnings are around $42.90, or about $1630 a week. Wages have grown approximately 8–9 times in nominal terms.
But the prices of the globally traded commodities that fill our lives, such as food, clothing, metals, electronics, energy, have risen far less than either wages or inflation. The result is that Australians today work fewer hours to buy most of the common things they consume day-to-day.
Tupy and Pooley tracked 50 foundational commodities, covering energy, food, raw materials and metals, and found that the global time price of this basket fell by around 72% between 1980 and 2018. For every basket you could buy in 1980, you could buy 3.5 baskets in 2018 for the same hours worked. In 2025 in Australia, you could buy 267% more of the these 50 commodities with the same amount of hours worked than you could have back in 1980. This improvement is less than the global average, but still progress. In fact, out of all 42 countries with data available, none were less abundant than they were in 1980. Greece had the lowest growth, but was still 121% more abundant than it was in 1980.
Zoom in on specific goods and the story is even more striking. Cheap clothing from globalised supply chains means a week’s wardrobe costs a fraction of what it did in 1980 in time-price terms. A colour television in 1980 required months of a worker’s income; today a large flat-screen costs the equivalent of a few days’ pay, and the quality is incomparably better. Food prices, adjusted for wages, have fallen dramatically. The average Australian household spends a far smaller share of income on groceries than their parents did. Petrol fluctuates, but in time-price terms, it is not radically more expensive than it was in the early 1980s.
- Food staples (wheat, rice, sugar, meat) — time price ↓ ~70–80% since 1980
- Consumer electronics — time price ↓ 90%+ since 1980
- Industrial metals (aluminium, copper) — real price ↓ 40–60% in real terms
- Prescription medicines (PBS-listed) — real out-of-pocket costs are ↓ substantially via PBS subsidy growth
- Air travel (domestic) — real price ↓ ~50–70% in real terms since deregulation
The underlying reason is one of the great under-appreciated stories of the modern era. More people = more innovation = more efficient production. Globalisation connected Australia to the cheapest and most productive manufacturers on earth. The household goods, food and raw materials that dominated the spending of an Australian family in 1980 are now a fraction of the burden they once were. If you only measured material abundance in these terms, 2025 would be an unambiguous golden age for ordinary Australians.
And beyond goods, Australians today enjoy freedoms and amenities their 1980 counterparts could barely imagine: instantaneous global communication, access to the world’s entire recorded cultural output at negligible cost, near-zero-cost photography, navigation, news and entertainment all in a pocket device. These are not captured in any commodity price index. The quality-of-life improvement, measured in time prices for information and entertainment, has been immense.

Part Two: Worse
The Great Housing Betrayal
Now for the bad news. And it isn’t great. While the prices of food and clothing were falling in real terms, Australian house prices were doing the opposite.
In Sydney in 1980, the median house price was $76,500. By 2000, it was $312,000. In 2010, it had risen to $575,900. In 2025, it was $1.4 million. Which means that the nominal price of a house in Sydney is more than 18x higher than it was in 1980. But our average wages have only increase by 8-9x what they were in 1980, which means that housing prices have more than doubled in comparison to our wages since 1980.
In 1980, the median house in Australia cost roughly 3–4x the annual household income. Today, it is 8.6x nationally and over 12x in Sydney. The price-to-income ratio has more than tripled since 1980, especially in a sought-after city like Melbourne or Sydney. For those that are already in the housing market, such as the Baby Boomers, this is great news for them and their economic stability and security. But the lack of housing affordability for those wanting to get into the housing market is one of the biggest policy failures in Australian economic history, and the negative consequences of it falls almost entirely on the young.
For the price of an average house in Sydney today, you could have bought 3.8 equivalent houses in 1980.
The causes are well understood, even if the politics of fixing them remain intractable. Financial deregulation in the mid-1980s opened the mortgage market, allowing more households to borrow more. The transition to low inflation in the 1990s pushed nominal interest rates down, which inflated asset values. Negative gearing and the 50% capital gains tax discount, introduced in 1999 at the peak of a rising market, created powerful incentives for investors to bid up the price of the existing housing stock. And throughout all of this, restrictive zoning and planning rules prevented the supply response that a functioning market would have generated.
The result is a deep and widening generational divide. Home ownership rates for Australians under 40 have fallen sharply. The primary determinant of whether a young Australian can own property is increasingly not their income or their savings discipline, but whether their parents own property and can transfer wealth to them. This is a fundamental break in the Australian ideal of a fair go. It is the clearest single way in which the life of a young Australian today is harder than it was for their parents’ generation at the same age.
There is one narrow consolation. Real housing rents, adjusted for quality, rose by only about 20% between 1980 and 2022. This is far less than purchase prices.
The financialisation of the housing market inflated asset values more than it inflated the underlying cost of shelter as a service. That distinction offers little comfort to renters facing a 1.7% vacancy rate and $681 median weekly national rent in 2025, but it does suggest that the problem is primarily one of asset pricing rather than an underlying scarcity of dwelling space.
Part Three: Mixed
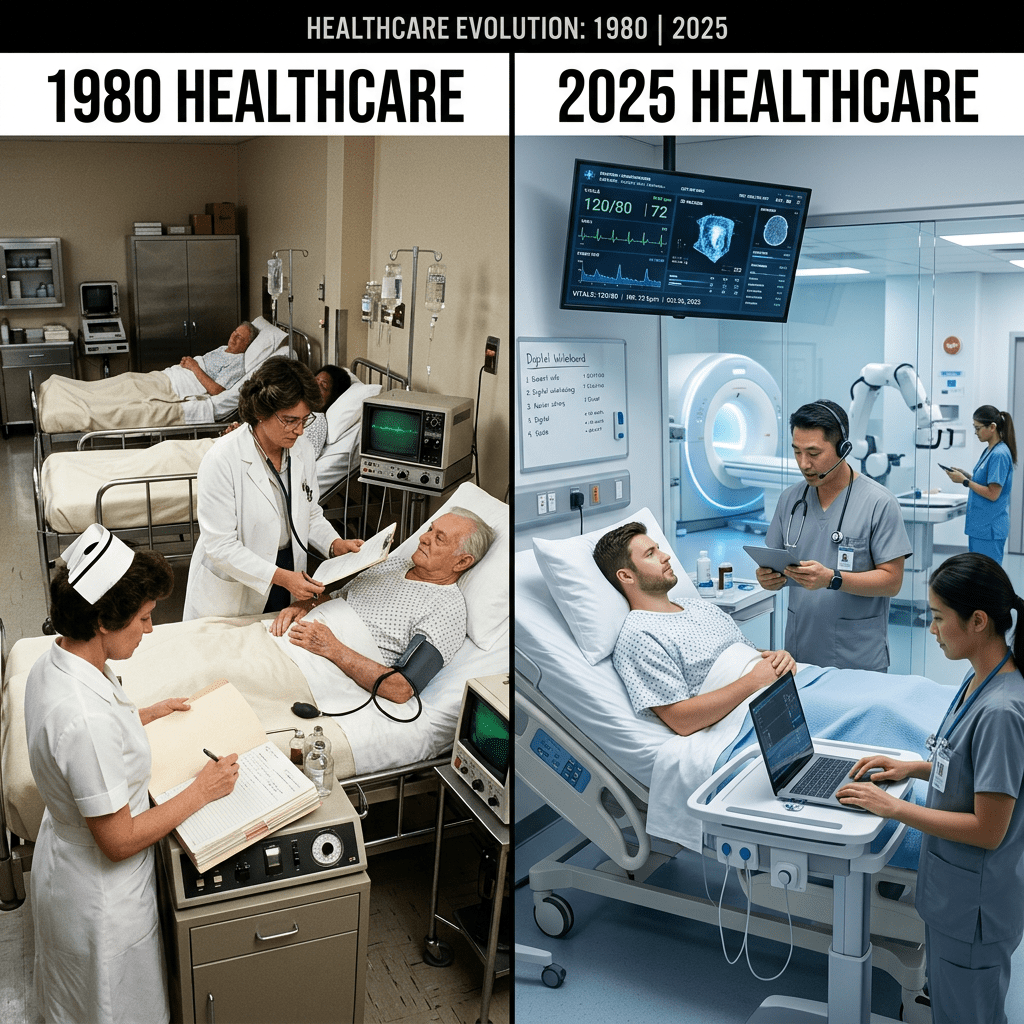
Healthcare: More Coverage and Better Quality but Rising Costs
Healthcare presents a genuinely mixed picture. It has improved in some important ways, and deteriorated in others. The fundamental difference between healthcare and the housing story is Medicare.
In 1980, universal healthcare coverage hadn’t fully formed in Australia. Medicare as we know it was introduced in 1984. Since then, the framework of universally subsidised GP visits, public hospital access, and the Pharmaceutical Benefits Scheme has delivered something remarkable. It has given mostly genuine access to good-quality healthcare for all Australians regardless of income, at zero or very low out-of-pocket cost for basic services. In time-price terms, this is a massive improvement. The cost of a GP visit, a public hospital stay, or most common medications is either free or a small co-payment. This is a far better deal than 1980 in time-price terms.
In 2023-2024, the average Australian spent $10,037 on their healthcare each year. 69.6% of these costs were being funded by the Australian government, which helped to protect individuals from the full cost.
Total real health spending per capita has grown roughly 3–4x since 1980. However, almost all of that increase has been absorbed by the government, not by individuals, like it has in the USA. So this means that what people experience as the “cost” of healthcare has been kept remarkably stable for basic services since 1980.
The quality of our healthcare, meanwhile, has kept improving. Treatments that did not exist in 1980 are now routine, survival rates for cancer and heart disease have transformed, and life expectancy has risen by nearly a decade.
The negative trends, however, are real and growing.
Out-of-pocket health costs have been rising faster than inflation since 1984. The biggest driver is private health insurance premiums, which rose 4.41% from April 2026 alone and have grown well above inflation levels for two decades now. Specialist gap fees, or the difference between what a doctor charges and what Medicare pays, have ballooned. At a rate that is much higher than inflation rates.
Dental care, which Medicare doesn’t seem to cover, has become a significant household burden, with a basic check-up costing $180–350 and complex procedures running to thousands of dollars. This has grown with or above inflation rates.
For Australians without private health insurance or high incomes, access to specialist and dental care is increasingly rationed by price in ways that have no real parallel in 1980.
The overall picture is that the quality of what Australians receive from the health system has improved dramatically, and the publicly-funded component remains genuinely affordable. But the private costs are growing, and for the young specifically, who are more likely to skip extras cover, including dental to save money. The result is that the young are more likely to defer specialist or dental care, or the out-of-pocket burden becomes real and rising.
Part Four: Way Worse
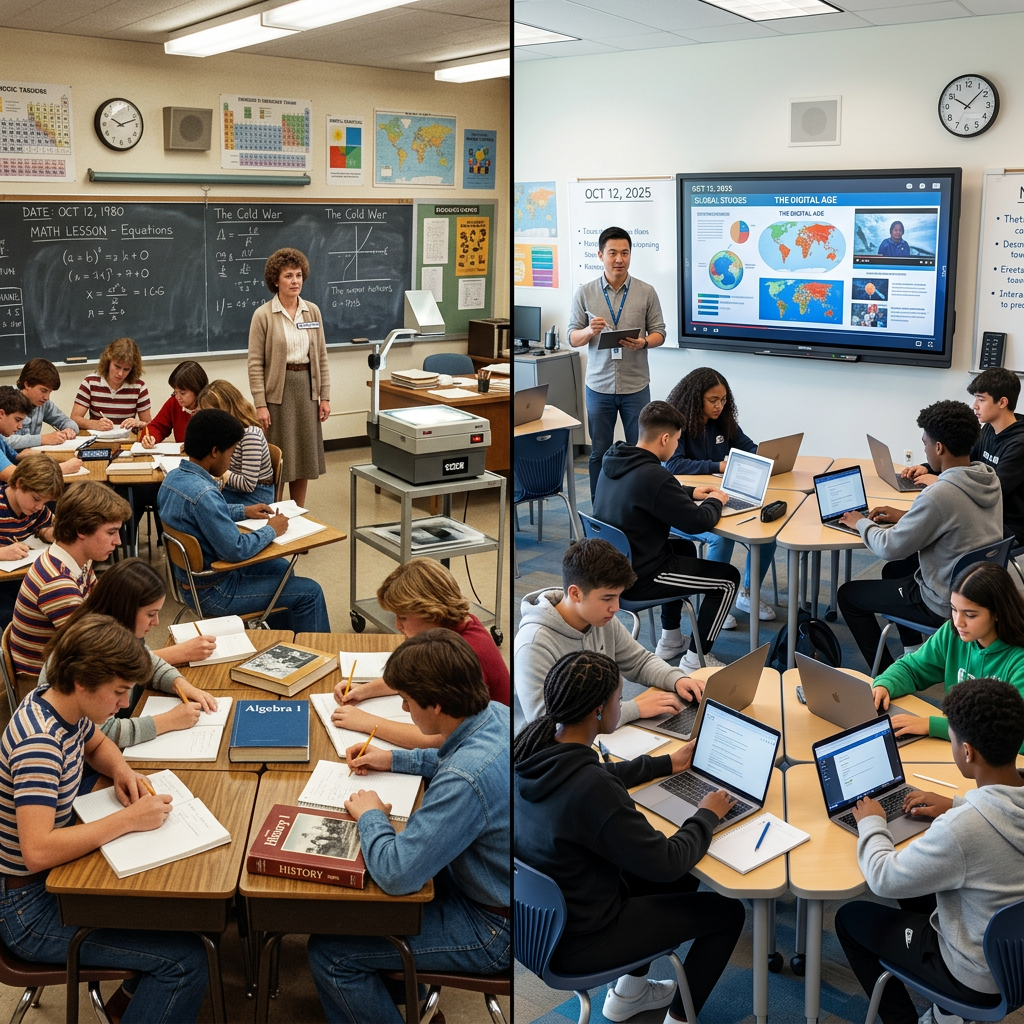
Education: The Cost That Didn’t Exist
This one requires almost no statistical gymnastics, because the direction of travel is unambiguous. A young Australian in 1980 paid nothing to attend university. A young Australian today graduates with a debt that will follow them for years or decades.
In 1974, Gough Whitlam abolished university fees, making tertiary education free for all Australians. In 1980, students were paying nothing. The Higher Education Contribution Scheme was introduced in 1989 at a flat rate of $1,800 per year for all courses. Through successive Howard, Rudd-Gillard and subsequent governments, fees were tiered, increased, and restructured. Today, arts and humanities degrees carry a student contribution of around $17,000 per year, totalling more than $50,000 for a three-year degree. Even discounted “priority” courses like nursing and teaching cost $13,000–14,000 in total student contributions.
The income-contingent nature of HECS repayments genuinely softens the burden compared to upfront fee systems. This means that students only start paying their HECS debt back once they are earning above $54,435. But it does not eliminate it. More than 50% of university graduates still carry a HECS debt at age 40.
Many report that HECS debt, combined with housing costs, materially delays major life decisions, such as buying a home, starting a family or taking career risks. The psychological weight of starting adult life in the red is real, even if the financial mechanics are more benign than they appear. 40% of Year 12 students in Australia now say that HECS debt concerns influence their decisions on what they should do after high school, or what course they should study.
There is a structural reason for the cost escalation. Government funding fell from roughly 80% of total university revenue in the early 1980s to around 40% today. Universities, now operating essentially as businesses competing for students and research funding, shifted the gap onto students. International student fees are an entire multi-billion-dollar industry that barely existed before the late 1980s.
Primary and High School education, by contrast, remains broadly publicly funded and accessible. State school quality varies significantly by location, but the structural cost to families of a publicly-educated child through to Year 12 is not dramatically higher in real terms than in 1980.
Private school fees have become more expensive since 1980. If you don’t send your children to a private school, the main burden of increased education costs falls almost entirely on those who pursue tertiary education. Thanks to labour market changes, this is a nearly essential for entry into the professional middle class.
The Big Picture
Two Economies, One Generation
The data tells a coherent story, even if it is a paradoxical one. In the economy of things, such as food, clothing, consumer goods, communications, entertainment and industrial materials, Australia in 2025 is unambiguously more abundant than in 1980. The mechanisms of innovation, global trade, and competitive markets have delivered the superabundance that Tupy and Pooley have documented. A young Australian today works fewer hours to fill their fridge, their wardrobe, and their home with technology than any generation before them.
In the economy of foundations, or the fixed assets and services that underpin a stable adult life, the direction has been the opposite. Housing, education debt, and private health costs have all increased significantly relative to wages. The time price of a home has roughly tripled. The time price of a university degree has gone from zero to one or more years’ median wages. The private costs of healthcare are rising faster than inflation year after year.
What explains this split?
The traded goods economy is subject to global competition, technological innovation and productivity gains that continuously push prices down. The foundations economy is characterised by inelastic supply, heavy government involvement, and in housing’s case, active policy settings that have rewarded asset holders at the expense of newcomers. When supply cannot keep up with demand, and when policy amplifies rather than dampens that dynamic, prices rise regardless of broader prosperity.
Young Australians today inhabit a strange paradox. They are richer in things than any generation that preceded them, and more locked out of the foundations of stability than any generation since the Great Depression.
The political implications are significant. Older Australians who bought homes before 1990 have received an extraordinary windfall. This is not through work or innovation, but through the systematic under-supply of housing relative to a growing population. Younger Australians have received the benefits of global trade and technological progress in consumer goods, but have seen those gains substantially redirected into housing costs, student debt repayments, and rising insurance premiums. A lot of the wealth in our society now resides in older generations and those who were lucky enough to invest in property back when it was more affordable.
None of this is inevitable or irreversible. The housing crisis, in particular, has policy solutions that are widely understood. We need meaningful planning reform to allow denser housing in established suburbs, the revision of tax settings that advantage investors over first-home buyers, and sustained investment in developing new and affordable housing. The student debt burden could be restructured or reduced, like the 20% reduction on HECS debt that occurred on July 1st, 2025. Out-of-pocket health costs could be brought within Medicare’s scope. These are choices that need to be made by policymakers to help give everyone “a fair go”.
Conclusion
The Question Isn’t Whether Progress Is Real. It’s Who Gets to Benefit From It, & Who Gets Left Behind?
The young Australian of today is not a victim. They live longer, travel further, communicate more freely and consume more material goods for less effort than anyone who came before them. Tupy and Pooley are right that the broad sweep of human progress has been remarkable, and Australia has participated fully in that story.
But progress is not evenly distributed, and the distribution has a generational dimension that is hard to ignore. The gains from globalisation and technological progress have flowed into household budgets for food and goods. The gains from decades of rising asset prices have flowed primarily to those who already own those assets, at the expense of those who do not and those who would one day like to.
The critical question for the next decade of Australian policy is simple. Will the economy of foundations, like homes, healthcare, education, be reformed so that more people can share in the superabundance that the economy of things already delivers? Or will a generation of young Australians remain, in the most material sense, renters in houses that the older generations own?
The answer will define whether Australia can ever truly be thought of as “the lucky country”.
References
Abelson, P., & Joyeux, R. (2023). Housing prices and rents in Australia 1980–2023: Facts, explanations and outcomes. ANU Crawford School of Public Policy. https://crawford.anu.edu.au/ttpi/content-centre/research/housing-prices-and-rents-australia-1980-2023-facts-explanations-and
Altus Financial. (2021). Comparing the affordability of Australian property over decades. https://www.altusfinancial.com.au/blog/comparing-the-affordability-of-australian-property-over-decades
Australian Bureau of Statistics. (2025, August). Employee earnings, August 2025. ABS. https://www.abs.gov.au/statistics/labour/earnings-and-working-conditions/employee-earnings/latest-release
Australian Bureau of Statistics. (2025, November). Average weekly earnings, Australia, November 2025. ABS. https://www.abs.gov.au/statistics/labour/earnings-and-working-conditions/average-weekly-earnings-australia/latest-release
Australian Bureau of Statistics. (2018, October). 70 years of inflation in Australia. ABS. https://www.abs.gov.au/statistics/research/70-years-inflation-australia
Australian Bureau of Statistics. (2026, February). Consumer price index, Australia, February 2026. ABS. https://www.abs.gov.au/statistics/economy/price-indexes-and-inflation/consumer-price-index-australia/latest-release
Australian Institute of Health and Welfare. (2025, October). Health expenditure Australia 2023–24. AIHW. https://www.aihw.gov.au/reports/health-welfare-expenditure/health-expenditure-australia-2023-24/contents/summary
Australian Institute of Health and Welfare. (2024, November). Health expenditure Australia 2022–23. AIHW. https://www.aihw.gov.au/reports/health-welfare-expenditure/health-expenditure-australia-2022-23/contents/summary
Datamentary. (n.d.). Australian house prices over the last 50 years: A retrospective. https://datamentary.net/australian-house-prices-over-the-last-50-years-a-retrospective/
Department of Health, Disability and Ageing. (2025, March). Out of pocket costs. Australian Government. https://www.health.gov.au/topics/private-health-insurance/what-private-health-insurance-covers/out-of-pocket-costs
Fenro. (2026, April). Australia’s healthcare costs in 2026 — what you are actually paying and why. https://fenro.com.au/healthcare-costs-australia-2026/
Global Property Guide. (2026, February). Australia’s residential property market analysis 2026. https://www.globalpropertyguide.com/pacific/australia/price-history
Norton, A. (2022, October 4). The five student contribution rationales since 1989. https://andrewnorton.id.au/2022/10/04/the-five-student-contribution-rationales-since-1989/
Pooley, G. L., & Tupy, M. L. (2021, April 22). The Simon Abundance Index 2021. Human Progress. https://humanprogress.org/the-simon-abundance-index-2021/
Reserve Bank of Australia. (n.d.). Inflation calculator. RBA. https://www.rba.gov.au/calculator/
Reserve Bank of Australia. (2007, April). Long-run trends in housing price growth. RBA Bulletin. https://www.rba.gov.au/publications/bulletin/2015/sep/3.html
Reserve Bank of Australia. (2026, March). Index of commodity prices 2026. RBA. https://www.rba.gov.au/statistics/frequency/commodity-prices/
Study Assist. (2026). Student contribution amounts. Australian Government. https://www.studyassist.gov.au/financial-and-study-support/commonwealth-supported-places/student-contribution-amounts
The Conversation. (2024). How did Australian universities go from free education to $50,000 arts degrees in 50 years? https://theconversation.com/how-did-australian-universities-go-from-free-education-to-50-000-arts-degrees-in-50-years-268782
Tupy, M. L., & Pooley, G. L. (2022). Superabundance: The story of population growth, innovation, and human flourishing on an infinitely bountiful planet. Cato Institute Press.
Wikipedia. (2025, December). Tertiary education fees in Australia. https://en.wikipedia.org/wiki/Tertiary_education_fees_in_Australia
Wikipedia. (2026). Australian property bubble. https://en.wikipedia.org/wiki/Australian_property_bubble
Wyatt, T., & Valderas, J. M. (2022). Real price of health — experiences of out-of-pocket costs in Australia: Protocol for a systematic review. BMJ Open. https://pmc.ncbi.nlm.nih.gov/articles/PMC9772657/

How can I help?